COVID-19: Global Testing and Genomic Variability
Associate Professor of Bioinformatics Georges Khazen creates an interactive dashboard for scientists and public health officials to follow developments of SARS-CoV-2 across the world.
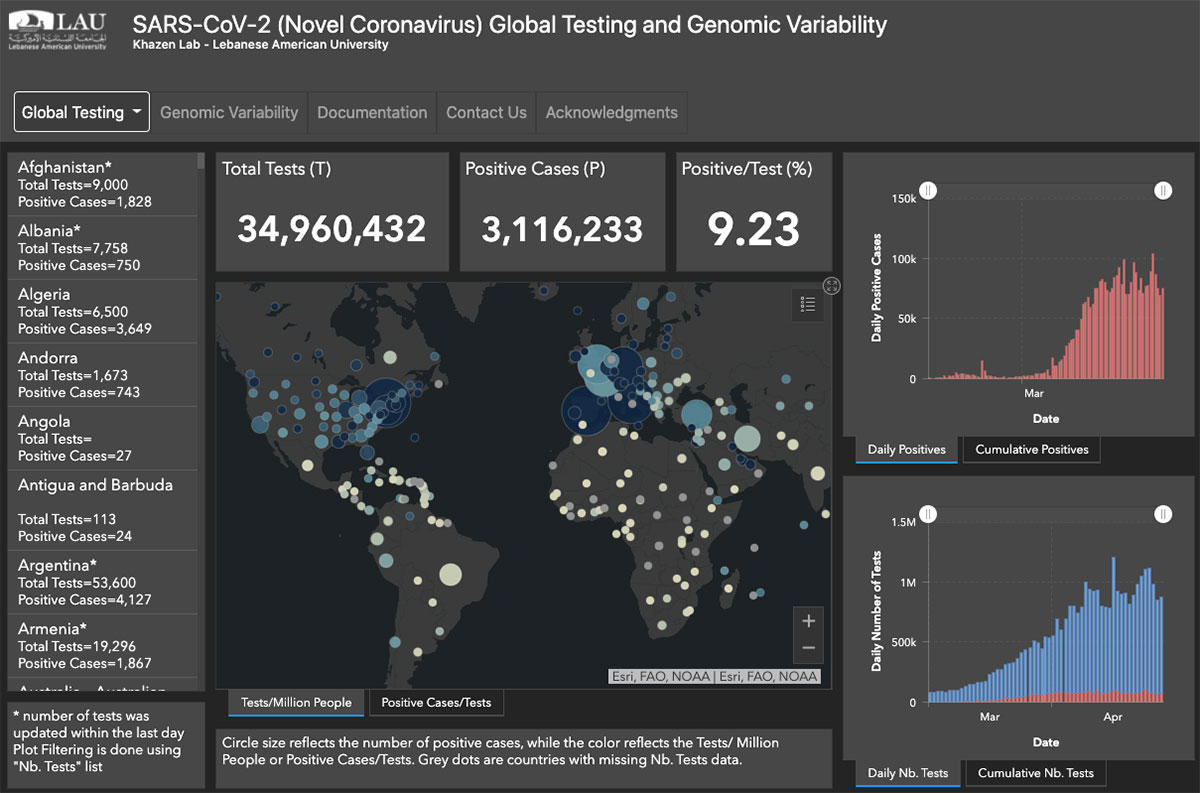
As the promulgation of propaganda and conspiracy theories about COVID-19 has created an infodemic, a team of LAU faculty and students, led by Associate Professor of Bioinformatics Georges Khazen in the School of Arts and Sciences (SoAS), has developed an interactive dashboard for validated historical testing data about the disease as well as the genomic variability of the SARS-CoV-2.
“The testing data can be used by the Ministry of Public Health to track how the pandemic is changing globally and choose the best mitigation strategies accordingly. It can also be used by hospitals and healthcare professionals to prepare for any potential increase in the number of cases and to ensure the required number of HCPs are on hand to deal with it,” Dr. Khazen said.
“Additionally, the genomic variability provides an insight on how the virus is changing within and between countries,” he added.
A month ago, the team, originally consisting of Dr. Khazen, post-doc fellow at LAU’s Gilbert and Rose-Marie Chagoury School of Medicine Halim Tannous, post-doc fellow in the Department of Computer Science and Mathematics Rasha Boulos and Senior Data Scientist Shadi Akiki, was participating in an international competition on Kaggle – an online community of data scientists – that aims to forecast the number of Covid-19 cases in different countries.
On finding incomplete and inconsistent data, the team decided to redirect their focus from the competition to “gathering and validating global testing data that would be shared with the scientific community through our dashboard.”
Dr. Tannous said the high level of inconsistencies in data – sometimes in the same country – posed a risk in its interpretation because the criteria for reporting is not standardized.
“For instance, some countries don’t specify if the tests statistics include multiple testing for the same individuals or not,” he said.
Furthermore, some of the numbers are overestimated in some countries and underestimated in others, while testing methods used are randomized in some countries and targeted in others, and “combining them will be misleading,” explained Dr. Tannous.
“Therefore, the main goal of this project is to consolidate and share this much-needed information that is currently unavailable on any other single platform,” he added.
Faced with the colossal amount of data and its dispersion, Dr. Khazen recruited the help of seven undergraduate students majoring in Bioinformatics and Computer Science to gather and validate the data.
Bioinformatics student Charlene Eid was assigned to gather data related to the number of tests conducted for Covid-19 in certain countries, the number of cases, deaths, recoveries, and any other relevant information.
“It has been very interesting to be a part of such an important project, and the professors we are working with, including our very own Dr. Georges Khazen, have been very helpful in guiding us through it as well,” she said of the experience.
The team works remotely and meets daily via videoconferencing, in accordance with the general mobilization in the country.
“We are using the notion.so platform to standardize, share and document how data is gathered, and the Slack platform as a communication tool for our remote team members. Everything is working smoothly and fine so far,” Dr. Khazen said.
Data is collected from multiple resources, like John Hopkins University dashboard, Our World in Data (Oxford University) as well as official Ministry of Public Health and governmental websites. It is first checked and validated then integrated into the platform.
“We currently have more than 3.5 million tests and 20 countries/states, such as Lebanon, Jordan, Iraq, Saudi Arabia to list a few, unreported in any other comprehensive resource,” he added.
The team has now added a genomic variability section that “shows the variability (mutation rate) of the virus obtained from individuals with the disease from 100 different countries/states and at different dates,” said Dr. Khazen.
More than 10,000 genomic samples are obtained from the GISAID database – an initiative that promotes the international sharing of all influenza virus sequences – and analyzed. The mutation rate and consequence type are reported for each part of the virus and can be explored both globally and nationally.
“We still need to associate these mutations with differences in the outbreak severity and potential drug targets,” he added.
Dr. Khazen said the main concern at the moment is to investigate the impact that such mutations have on a potential vaccine and drugs.
“If the mutations occur frequently in the epitope, that is to say the target to which the antibody attaches itself, then there is a high chance that the vaccine will become ineffective, calling for the design of a new one,” he explained.
The team is currently adding new layers of information on a daily basis and is applying for a grant from the National Council of Scientific Research (CNRS) in order to recruit more research assistants.
“We strongly believe that this will provide essential information to help the scientific community and accelerate their research against COVID-19,” said Dr. Tannous.
The dashboard was made public on April 20, 2020.